It takes more than a tweet to make a company social. This is part 6 of a 7 part series.
As with most online activities you can measure pretty much everything. That’s both an advantage and a disadvantage!
There are two types of measurement to think about; measuring success and measuring the process.
Measuring Success
The really important measure is around whether you meet your business goals. These are drawn from the strategy you’ve defined earlier. For example;
- Increasing sales (or qualified leads)
If this is within your online sales environment it is relatively easy to measure using tagged URLs or cookies, but often people buy in a physical store based on their online experience. In which case you could use a discount coupon to social media buyers to estimate the social influence or you may need to research whether in store buyers did see your social media campaign. The last option sounds complicated but it could be as simple as sales personnel asking “did you know about our Facebook campaign?”
- Brand awareness and brand recognition
If you’re using social media to build brand awareness and brand recognition you can measure via survey whether more people recognise your brand.
- Brand Perception
If your goal was changing how your company is seen then you can measure via surveys whether the public perception of you has changed.
- Improved Service
Some companies make significant use of social media to provide services to their customers, KLM the Dutch airline does this particularly well, solving thousands of customer queries per day on their social media channels. This has become a brand builder for KLM.
One of the tricky things about these measures is that the change measured might not be entirely due to social media, since it’s unlikely that a company will improve only its social media without other communications, marketing and campaigns happening at the same time. To tease this out you could use specific questions within a survey, ask customers, or ask your followers on social media.
Pick 1-3 KPIs that align with your business goals and measure those. The “K” in KPI stands for “Key”, if you’re measuring more than 3 they are no longer the key performance indicators.
Measuring the Process
There is a loose relationship between the number of followers you have, the amount of engagement, and the number of people who take action. I have sometimes likened this to the traditional sales funnel, but it’s a very very leaky funnel.
- Followers
“Followers” is often dismissed as a vanity metric, and I agree that if you are running a twitter account with the goal of getting a million followers it is a vanity metric.
But the truth is if you have zero followers you’re not having any impact, and the more followers you have the bigger your potential reach and the bigger your potential impact. I should qualify that – quality followers – fake accounts, dead people, and bots don’t count. That quality requirement is why you should never pay for followers. Follower and fan numbers tell you that you’re getting some traction with your activities.
- Reach
Measure how many people saw your posts – this is likely to be a lot less than the number of people who follow you. Twitter feeds move fast, and not all your followers on Facebook will see all your posts in their timeline.
- Engagement Rate
How many likes, retweets, +1s etc do your posts get divided by some measure of the audience.
It’s a good measure of how your content is being received but it should be treated carefully since it is presented as percentage. A large drop in engagement might be that your content got worse, or that your audience grew massively, and the new arrivals are less engaged. When using this measure I look at the trend, and at the underlying figures of total number of engagements and audience. It’s worth remembering that engagement by itself is not a strategy, it’s part of the process to reach your strategy.
- Click Through Rate
The number of clicks from social posts through to your website, divided by the reach of those posts. If your goal is to drive traffic to your site then this is a crucial measure.
- Applause rate
The number of shares/retweets/+1s etc divided by the number of posts. This is a measure of content quality, and is therefore useful for those creating content. However it doesn’t seem to be commonly used (Engagement rate is preferred) and it comes with a caveat; we know that pictures of beautiful babies or cute kittens will generate a high applause rate, but unless you’re in a very specific industry that won’t help you reach your business goals.
- Fan value
This is a perennial marketing question, and the real answer is that varies for lots of reasons, explained very well by Oliver Blanchard. To be pragmatic and arrive at a useful answer for you, you would need to calculate the value generated by your facebook page/youtube channel/twitter account, and divide that by the total number of fans/followers (on a per channel basis). This becomes a useful measure when you are trying to justify investment in the channel.
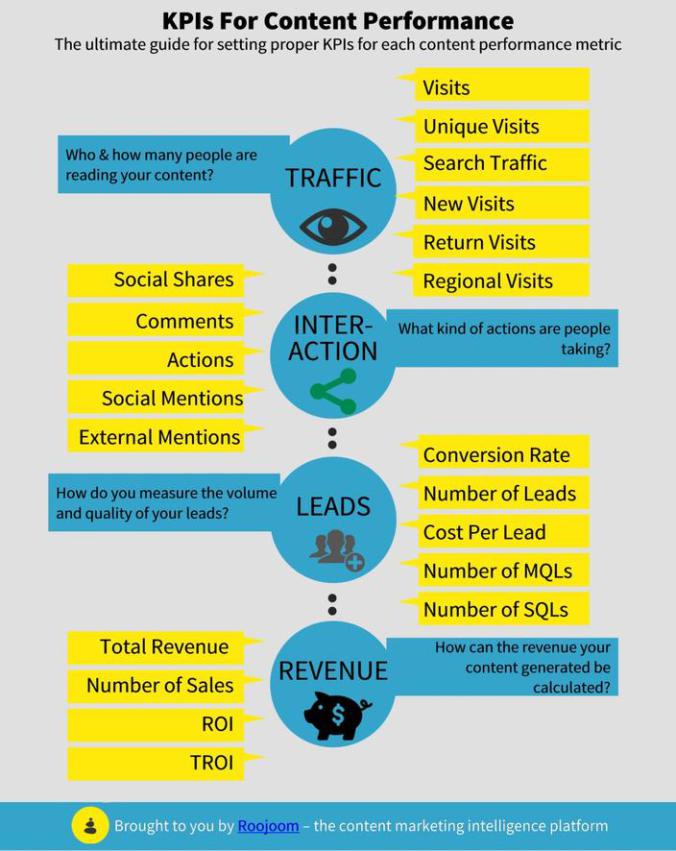
There are many more measures possible, as discussed in this handy Guide to KPIs for Content performance.
But the reality is it’s time-consuming to measure everything. Pick the measures that give you information about how you are reaching your business goal, understand how each of those measures is tracked and what the limits might be and measure those.
Your process goals tell you whether you’re on track to meet your business goals. They also tell you whether you need to alter your content, frequency of posting, time of posting, or promotional budget. You should be looking at them at least daily.
 CASE STUDY; NewArtMuseum
The NewArt Museum’s goal is to increase the number of younger people, between 18-30, visiting the museum.
The measurement for that business goal is very clear; number of young people visiting the museum should go up. Measuring that is trickier, you will need to ask visitors some information.
NewMuseum takes a baseline measurement by asking all visitors to complete a short survey as they leave the museum during a single week. One of the questions is around age; and gives age brackets for the visitor to choose from. They also ask which information source people would like for their museum news; (paper) newsletter, email, newspaper, social media, to help shape the future communications.
In about the third week of the new initiative they make the same survey, but ask those in the target audience some additional questions. One finding is that that the target age group works during the week, so could only ever visit on a weekend. This insight leads to the museum opening on Friday nights with music and events aimed at the 18-30 age group.
For the social media part of the campaign the goal is building an audience in their target age group. The chosen platforms are facebook, instagram and experimenting with periscope for some “behind the scenes action”.
On all platforms they measure follower numbers and engagement. When they get closer to re-opening day New Museum tries two things; Firstly a targetted discount ticket offer via facebook for which they measure click through rate. Secondly a campaign on Instagram using the hashtag #NewMuseum which asks people to post images of things they thing are design icons. The social media team will choose a favourite image of the day and reward that person with two free tickets to the opening. The social media team then measures the reach of the campaign, and looks for comments that indicate people want to visit the museum as indicating intent.
It takes more than a tweet to make a company social. This is part 6 of a 7 part series.
As with most online activities you can measure pretty much everything. That’s both an advantage and a disadvantage!
There are two types of measurement to think about; measuring success and measuring the process.
Measuring Success
The really important measure is around whether you meet your business goals. These are drawn from the strategy you’ve defined earlier. For example;
- Increasing sales (or qualified leads)
If this is within your online sales environment it is relatively easy to measure using tagged URLs or cookies, but often people buy in a physical store based on their online experience. In which case you could use a discount coupon to social media buyers to estimate the social influence or you may need to research whether in store buyers did see your social media campaign. The last option sounds complicated but it could be as simple as sales personnel asking “did you know about our Facebook campaign?”
- Brand awareness and brand recognition
If you’re using social media to build brand awareness and brand recognition you can measure via survey whether more people recognise your brand.
- Brand Perception
If your goal was changing how your company is seen then you can measure via surveys whether the public perception of you has changed.
- Improved Service
Some companies make significant use of social media to provide services to their customers, KLM the Dutch airline does this particularly well, solving thousands of customer queries per day on their social media channels. This has become a brand builder for KLM.
One of the tricky things about these measures is that the change measured might not be entirely due to social media, since it’s unlikely that a company will improve only its social media without other communications, marketing and campaigns happening at the same time. To tease this out you could use specific questions within a survey, ask customers, or ask your followers on social media.
Pick 1-3 KPIs that align with your business goals and measure those. The “K” in KPI stands for “Key”, if you’re measuring more than 3 they are no longer the key performance indicators.
Measuring the Process
There is a loose relationship between the number of followers you have, the amount of engagement, and the number of people who take action. I have sometimes likened this to the traditional sales funnel, but it’s a very very leaky funnel.
- Followers
“Followers” is often dismissed as a vanity metric, and I agree that if you are running a twitter account with the goal of getting a million followers it is a vanity metric.
But the truth is if you have zero followers you’re not having any impact, and the more followers you have the bigger your potential reach and the bigger your potential impact. I should qualify that – quality followers – fake accounts, dead people, and bots don’t count. That quality requirement is why you should never pay for followers. Follower and fan numbers tell you that you’re getting some traction with your activities.
- Reach
Measure how many people saw your posts – this is likely to be a lot less than the number of people who follow you. Twitter feeds move fast, and not all your followers on Facebook will see all your posts in their timeline.
- Engagement Rate
How many likes, retweets, +1s etc do your posts get divided by some measure of the audience.
It’s a good measure of how your content is being received but it should be treated carefully since it is presented as percentage. A large drop in engagement might be that your content got worse, or that your audience grew massively, and the new arrivals are less engaged. When using this measure I look at the trend, and at the underlying figures of total number of engagements and audience. It’s worth remembering that engagement by itself is not a strategy, it’s part of the process to reach your strategy.
- Click Through Rate
The number of clicks from social posts through to your website, divided by the reach of those posts. If your goal is to drive traffic to your site then this is a crucial measure.
- Applause rate
The number of shares/retweets/+1s etc divided by the number of posts. This is a measure of content quality, and is therefore useful for those creating content. However it doesn’t seem to be commonly used (Engagement rate is preferred) and it comes with a caveat; we know that pictures of beautiful babies or cute kittens will generate a high applause rate, but unless you’re in a very specific industry that won’t help you reach your business goals.
- Fan value
This is a perennial marketing question, and the real answer is that varies for lots of reasons, explained very well by Oliver Blanchard. To be pragmatic and arrive at a useful answer for you, you would need to calculate the value generated by your facebook page/youtube channel/twitter account, and divide that by the total number of fans/followers (on a per channel basis). This becomes a useful measure when you are trying to justify investment in the channel.
There are many more measures possible, as discussed in this handy Guide to KPIs for Content performance.

But the reality is it’s time-consuming to measure everything. Pick the measures that give you information about how you are reaching your business goal, understand how each of those measures is tracked and what the limits might be and measure those.
Your process goals tell you whether you’re on track to meet your business goals. They also tell you whether you need to alter your content, frequency of posting, time of posting, or promotional budget. You should be looking at them at least daily.
 CASE STUDY; NewArtMuseum
The NewArt Museum’s goal is to increase the number of younger people, between 18-30, visiting the museum.
The measurement for that business goal is very clear; number of young people visiting the museum should go up. Measuring that is trickier, you will need to ask visitors some information.
NewMuseum takes a baseline measurement by asking all visitors to complete a short survey as they leave the museum during a single week. One of the questions is around age; and gives age brackets for the visitor to choose from. They also ask which information source people would like for their museum news; (paper) newsletter, email, newspaper, social media, to help shape the future communications.
In about the third week of the new initiative they make the same survey, but ask those in the target audience some additional questions. One finding is that that the target age group works during the week, so could only ever visit on a weekend. This insight leads to the museum opening on Friday nights with music and events aimed at the 18-30 age group.
For the social media part of the campaign the goal is building an audience in their target age group. The chosen platforms are facebook, instagram and experimenting with periscope for some “behind the scenes action”.
On all platforms they measure follower numbers and engagement. When they get closer to re-opening day New Museum tries two things; Firstly a targetted discount ticket offer via facebook for which they measure click through rate. Secondly a campaign on Instagram using the hashtag #NewMuseum which asks people to post images of things they thing are design icons. The social media team will choose a favourite image of the day and reward that person with two free tickets to the opening. The social media team then measures the reach of the campaign, and looks for comments that indicate people want to visit the museum as indicating intent.